Wyoming K-12 school personnel reportedly feel they've been required to "teach to the test" for a number of years now. Our previous article documented how, overall, the state is not excelling at doing that though a few individual school districts scoring well and a handful are showing improvement. This article focuses on the improvement (or lack of it) districts posted regardless of their overall level of achievement. It uses Wyoming's PAWS (Proficiency Assessments for Wyoming Students) data, so we're talking only about our kids, our schools and our test.
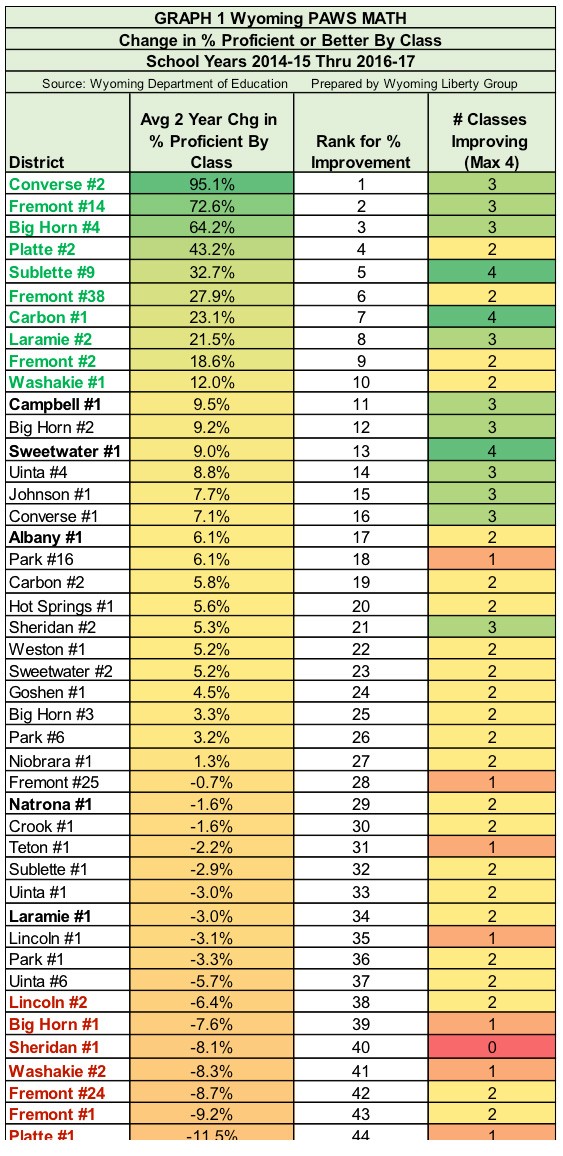
PAWS in its current form was administered in 2014-5, 2015-16 and 2016-17, thereby providing two years' results to compare to the 2014-15 base year. Graph 1 reports Converse #2 topped the 48 districts with an eye-popping average proficiency improvement of 95.1 percent in the two years across grades 3-6. In addition, three out of four of the classes posted improvement, the exception being the 6th grade class of 2014-15, which actually declined 6 percent. That decline was more than offset by the 71 percent, 274 percent and 43 percent increases in the other classes.
Honorable mentions go to Sublette #9, Carbon #1 and Sweetwater #1 which managed to get all four classes to improve over the two-year period. Such performance implies consistency of quality over time and across grades.
Campbell #1 did the best of the five biggest districts and was 11th overall, pegging a 9.5 percent average increase across the classes. Three out of four of their classes posted improved proficiency. Sweetwater #1 and Albany #1, also among the five largest districts, ranked 13 and 17 overall for improvement.
Unfortunately, both Natrona #1 and Laramie #1, by far the state's two biggest districts, averaged decreases in proficiency overall across the four classes, with only two of them posting positive results. The Natrona #1 3rd and 6th grade classes posted 18 and 9 percent improvement, respectively, but those encouraging signs were eclipsed by the 4th and 5th grade classes at -13 and -20 percent declines.
Laramie #1 ranked 34th of 48 districts, far behind the other four large districts, with -3 percent overall change in proficiency. Two classes, 3rd and 4th showed proficiency gains of 9 and 11 percent. However, those were overwhelmed by declines of -6 and -26 percent in the two older classes. Perhaps Natrona #1 and Laramie #1 are simply too big to usher kids through effectively.
Praise is due to all the districts which posted overall proficiency increases. Even though their overall levels of proficiency may not be high, their efforts to improve the math proficiency of the children under their care deserve thankful recognition. We urge them to keep working for higher levels of excellence.
Hopefully, these rankings will start a sense of healthy competition among districts for improving achievement, encouraging whole districts to perform better, not just individual schools.
For those interested in the methodology behind the data in Graph 1, a description follows.
Graph 2 illustrates the analysis, showing the math proficiency (or better) of Albany County #1 children, by class, for three years. By class, we mean those who were a particular grade in 2014-15 advancing to the next higher grade in 2015-16 and then again in 2016-17. For example, we see the third-grade class of 2014-15 (shaded blue) go from 57.4 percent proficient in 2014-15 to 63.7 percent in 2015-16 (as fourth-graders) and thence to 64.2 percent as fifth-graders. Their change (as a class) from 2014-15 to 2016-17 was an overall improvement of 11.9 percent.
Similarly, we see the fourth-grade class of 2014-15 (green) improve nearly 22 percent over the two years. Unfortunately, though, we see the fifth and sixth-grade classes actually decline (-7.2 and -1.9 percent) in grade level proficiency (i.e more kids not reaching state standards).
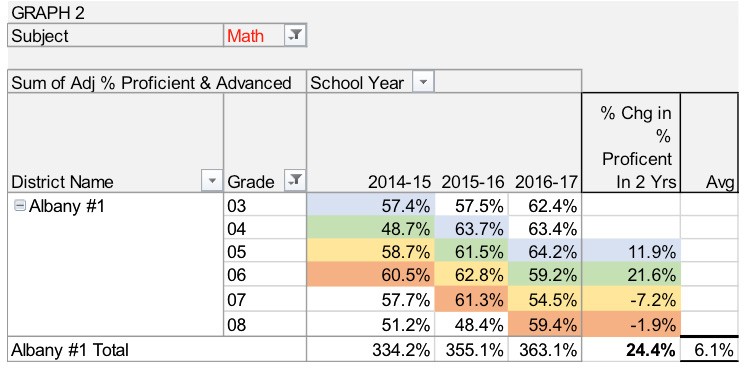
The overall average proficiency change for Albany #1 was 6.1 percent. We applied this methodology to all districts.
In order to attribute changes in proficiency to the efforts of the school, this approach necessarily assumes the children in each class remain largely the same from year to year. Of course, the validity of this assumption will vary from year to year and district to district.