Mailing Address: 1740 H Dell Range Blvd. #274
Cheyenne WY 82009
Phone: (307) 632-7020
by Wyoming Liberty Group Staff
In response to questions from a couple of blog readers, here is a short review of the industrial structure of the Wyoming economy.
One reader wanted to know how much each industry contributes to our state's economy; the other asked what industries provide the biggest tax base. These two questions are about the same topic, namely the composition of GDP. This composition, in turn, can be viewed from a few different angles. First, there are three methods to calculate GDP:
Spending: how much money do we spend on consumption, investments, government programs and foreign trade?
Income: How much money do we make, through capital ownership and through work?
Value added: How much does each step of production, in each industry, add to the total value of production?
By definition, all these three methods add up to the same amount. However, not all three methods are equally easy to track at the state level. For example, we do not have data on business investments in Wyoming at the same level of rigor as we do income and production value.
All methods for calculating GDP can be done in fixed prices or current prices. If we want to know where growth comes from in an economy, the fixed-price calculation is the appropriate one to use. The current-price calculation gives us the tax base.
Starting with the former, Figure 1 reports the industrial composition of the Wyoming economy, broken down to ten sectors. Currently, minerals is the largest industry, contributing 27.6 percent to state GDP, followed by real estate services and infrastructure (transportation, warehousing and utilities) at ten percent. Wholesale and retail trade add up to 9.4 percent with health care and construction coming in at 4.2 percent.
Accommodation and food services only add three percent to our state's fixed-price GDP. Government, on the other hand, is responsible for almost 14 percent, making it the second largest industry.
All other industries add up to 15.6 percent:
Figure 1
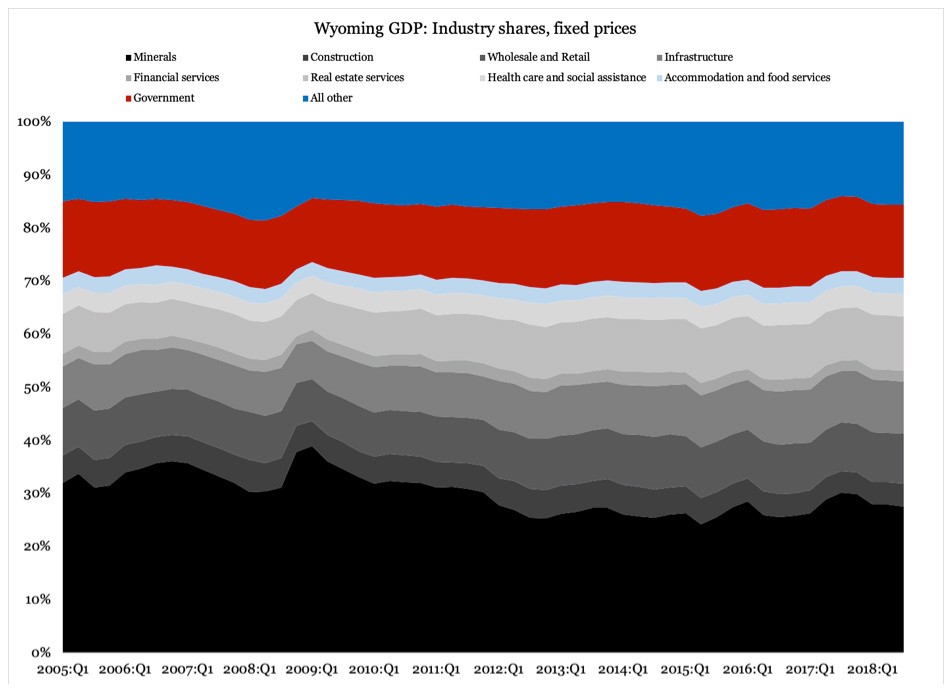
Source: Bureau of Economic Analysis
As Figure 1 explains, the growth base in our state's economy has shifted in recent years. The shift is not dramatic, but as the minerals share has shrunk from 32 percent in 2005 to less than 28 percent today, industries such as real estate services and infrastructure have grown in relative importance.
In terms of tax base, the composition looks a bit different. The reason is the price inflation that tends to hit some industries, especially minerals:
Figure 2
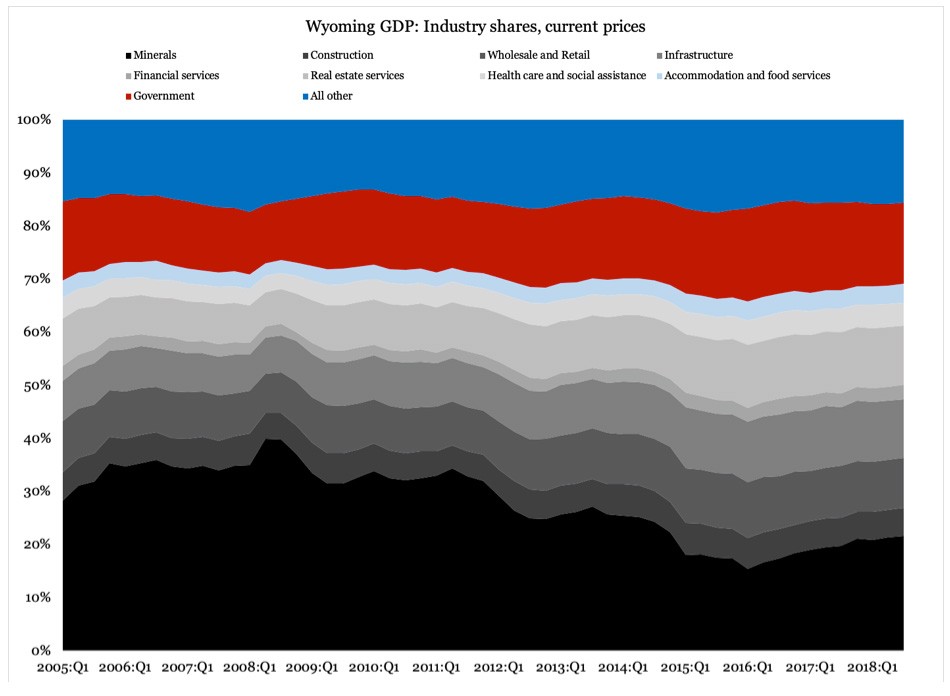
Source: Bureau of Economic Analysis
The decline in minerals as a tax base is notable: from averaging 35 percent in 2005-2006, its share was below 22 percent in 2018.
When those who call for a reform to the Wyoming tax system point to the declining share of minerals, they do make a good statistical point. This, however, does not translate into a good policy point. The problem, namely, is that a discussion about a tax reform without any preceding discussion about spending reform, will only expand the tax burden outward from minerals. It would not mean a more fiscally sustainable government – only a more burdensome government.
By accepting you will be accessing a service provided by a third-party external to https://wyliberty.org/
Mailing Address: 1740 H Dell Range Blvd. #274
Cheyenne WY 82009
Phone: (307) 632-7020